“Performance isn’t a problem — until it suddenly is.”
This started as an internal doc for my AI team after a few weeks of debugging a slow Elasticsearch cluster. It’s a checklist of things to verify, plus a few twists I didn’t see coming.
Check the number of shards in a specific index
from elasticsearch import Elasticsearch

es_client = Elasticsearch(...)

settings = es_client.indices.get(index=es_index.name)

for index, config in settings.items():
    num_shards = config['settings']['index']['number_of_shards']
    num_replicas = config['settings']['index']['number_of_replicas']
    print(f"Index: {index}")
    print(f"  Primary shards: {num_shards}")
    print(f"  Replicas per shard: {num_replicas}")
Or, for any index:
shards = es_client.cat.shards(format="json")

for shard in shards:
    print(f"Index: {shard['index']} | Shard: {shard['shard']} | State: {shard['state']} | Node: {shard['node']}")
Notes:
- Primary shards: where the original data lives
- Replica shards: where the original data is copied
Two benefits to having replicas:
- High availability: Elasticsearch auto-routes requests to replicas if primary shards fail
- Auto-balancing: reduces load on primaries by sharing read requests with replicas
Each index has its own shards. So if there are n indexes and each has k shards, the total is n × k. That leads to the first rule of thumb:
👉 In a single node, there should only be 50–100 shards in total.
So if each index has 1 shard, that’s 50–100 indexes per node max. You can estimate the cap from the shards you reserve per index.
from collections import Counter

shard_counts = Counter([shard["node"] for shard in shards])
print("Shard distribution per node:")
for node, count in shard_counts.items():
    print(f"  {node}: {count} shards")
Second rule of thumb — shard sizing:
| Shard size | Status | Use when… |
|---|---|---|
| 10–50 GB | Ideal | Most general-purpose use cases |
| <10 GB | Too small | May cause segment bloat, inefficiency |
| 50–100 GB | Acceptable | Only if node RAM/heap is large |
| >100 GB | Risky | Prone to GC issues, long recoveries |
Let’s calculate the average shard size:
total_size_mb = 0
shard_count = 0

for shard in shards:
    store_size = shard.get("store", "0mb").lower()
    if store_size.endswith("gb"):
        size = float(store_size[:-2]) * 1024
    elif store_size.endswith("mb"):
        size = float(store_size[:-2])
    else:
        size = 0
    total_size_mb += size
    shard_count += 1

avg_size = total_size_mb / shard_count if shard_count else 0
print(f"\nAverage shard size: {avg_size:.2f} MB")
Why too-small shards hurt:
- More shards = more file handles, caches, merges
- Higher JVM overhead
- Search coordination slows down
- Memory fragmentation
Check the number of segments in your index
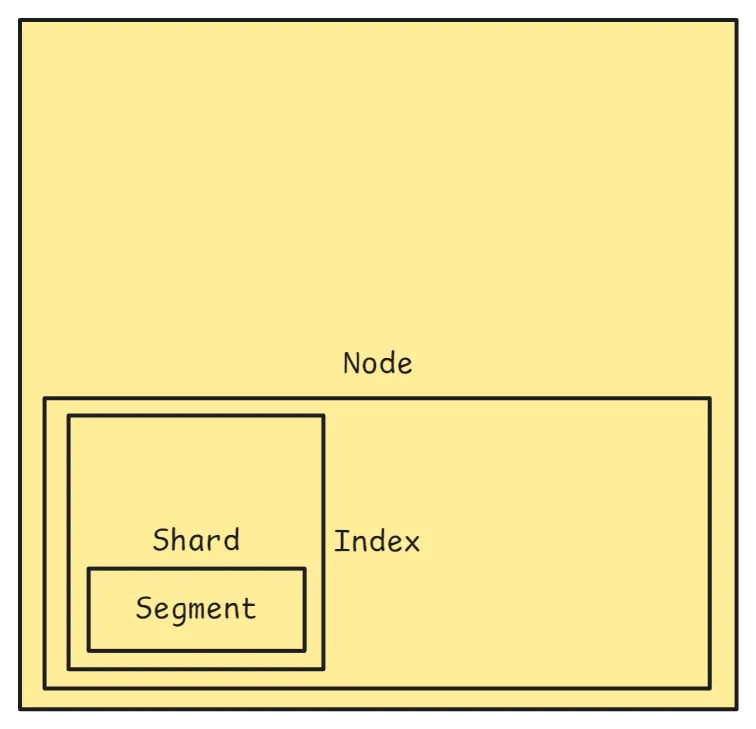
Think of it like this:
- An index has many shards
- A shard is a self-contained Lucene index (Lucene is the search tech under Elasticsearch)
- Each shard contains multiple segments
- A segment is a small snapshot of documents — a mini read-only index
🧩 Segments are added over time as documents are indexed and refreshed.
(Holy sh*t 🥲)
Let’s check how many segments we have in some random index:
segments = es_client.indices.segments(index=es_index.name)

for shard_id, shard_info in segments['indices'][es_index.name]['shards'].items():
    for replica in shard_info:
        segment_count = replica['num_search_segments']
        node = replica['routing']['node']
        print(f"Shard {shard_id} on node {node} → {segment_count} segments")
If there are too many segments, we have to merge them — heads up, this takes time:
response = es_client.indices.forcemerge(
    index=es_index.name,
    max_num_segments=2,
    only_expunge_deletes=False,
    flush=True,
    wait_for_completion=True,
    request_timeout=600,
)

print("Force merge triggered:", response)
This leads to the next lesson I learned.
Refresh is expensive
A refresh is the process by which Elasticsearch makes newly indexed documents searchable. By default, it happens every second (or based on index.refresh_interval).
- Pro: new data is quickly available for search
- Con: frequent refreshes are expensive — they flush memory to disk and create new segments
When you’re indexing a large volume of documents, auto-refreshing every second:
- Slows down indexing (constant flushing and segment merging)
- Burns I/O, CPU, and memory
Best practice during bulk indexing:
- Temporarily disable refresh
- Perform your bulk indexing
- Manually refresh once at the end
- Restore the refresh interval (optional)
In code:
from elasticsearch import Elasticsearch, helpers

es = Elasticsearch("http://localhost:9200")

INDEX_NAME = "my-index"

# 1. Disable automatic refresh
es.indices.put_settings(
    index=INDEX_NAME,
    body={"index": {"refresh_interval": "-1"}},
)

# 2. Bulk indexing
documents = [
    {"_index": INDEX_NAME, "_id": i, "_source": {"title": f"Doc {i}", "value": i}}
    for i in range(10000)
]

helpers.bulk(es, documents)

# 3. Manually trigger a refresh
es.indices.refresh(index=INDEX_NAME)

# 4. Restore the default refresh interval (optional)
es.indices.put_settings(
    index=INDEX_NAME,
    body={"index": {"refresh_interval": "1s"}},
)

print("Bulk indexing completed with optimized refresh settings.")
Profile your query (most important)
Profiling a request is an important feature in pretty much any database. The point is to dissect a query into phases and see how long each phase takes — the ultimate indicator of performance, and the easiest way to identify the actual bottleneck.
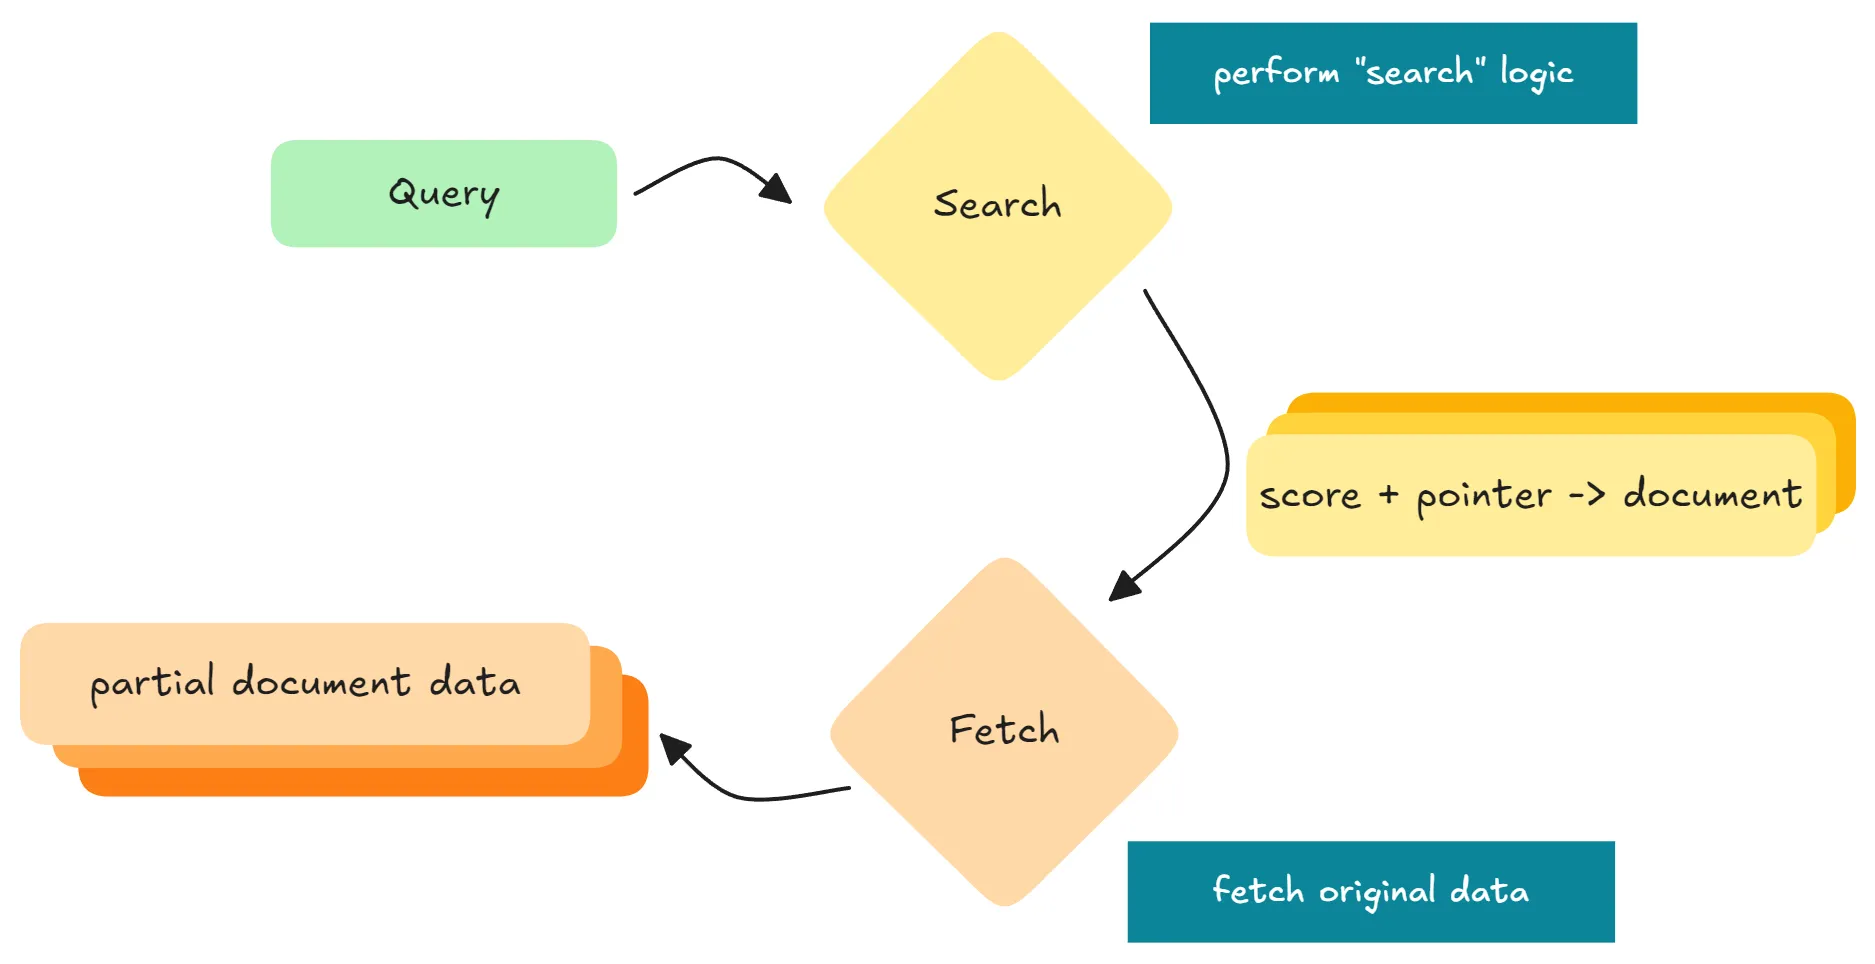
In Elasticsearch, a normal query has two parts:
- Searching: each shard runs the search and retrieves scores and “references” of hits
- Fetching: Elasticsearch combines and fetches the actual data (from memory + disk) to assemble the response
Let’s try:
# this is how we did it in our code originally
# we disable source (source=False) so the query only returns score + id
# only data from memory, so it should be fast right?

profile = es_client.search(
    index="search_185_dev_v1",
    profile=True,
    size=10000,
    source=False,
    query={
        "match": {
            "block.text.text": "AI"
        }
    },
)

print("Profile took:", profile["took"], "ms")
for shard in profile["profile"]["shards"]:
    print("Shard query time:", shard["searches"][0]["query"][0]["time_in_nanos"] / 1e6, "ms")
print("Shard fetch time:", shard["fetch"]["time_in_nanos"] / 1e6, "ms")Wrong. It’s very slow.
To see more details, you can print the whole profile data:
print(json.dumps(dict(profile)['profile'], indent=2))Profile result example
{
  "shards": [
    {
      "id": "[61N79He-S1u1hbGEXAHJAw][external_referential_rncp_dev_v1][0]",
      "node_id": "61N79He-S1u1hbGEXAHJAw",
      "shard_id": 0,
      "index": "external_referential_rncp_dev_v1",
      "cluster": "(local)",
      "searches": [
        {
          "query": [
            {
              "type": "ConstantScoreQuery",
              "description": "ConstantScore(*:*)",
              "time_in_nanos": 2606684,
              "breakdown": { "next_doc": 2566124, "next_doc_count": 10001 }
            }
          ],
          "rewrite_time": 8000,
          "collector": [
            {
              "name": "QueryPhaseCollector",
              "reason": "search_query_phase",
              "time_in_nanos": 7681516
            }
          ]
        }
      ],
      "aggregations": [],
      "fetch": {
        "type": "fetch",
        "time_in_nanos": 2911239639,
        "breakdown": {
          "load_stored_fields": 2891235809,
          "load_stored_fields_count": 10000
        }
      }
    }
  ]
}
Some terminology:
| Parameter | Pulls from | Best use case |
|---|---|---|
_source | Original JSON | Return full or partial documents |
stored_fields | Stored fields (if enabled) | Retrieve specific fields quickly |
fields | Doc values or stored | Show fields in search results, flexible |
docvalue_fields | Doc values | Retrieve formatted numbers/dates |
More details on each parameter
_source
- The original JSON document as it was indexed
- A search or get request returns it (entirely or partially) by default
- Stored by default, very flexible
"_source": ["title", "author"]Returns only those fields from the original document.
✅ Use when: you want the actual document content.
stored_fields
- Refers to fields that have
store: truein the mapping - By default, fields are not separately stored (because
_sourcealready keeps the full doc) - Only useful if you’ve explicitly enabled
store: truefor a field
"stored_fields": ["title"]If store: true wasn’t set for title, this returns nothing.
✅ Use when: you need fast access to specific fields and don’t want to load the full _source.
fields
- Retrieves field values using field data, doc values, or stored fields
- Unlike
stored_fields, this works even ifstore: trueisn’t set - Can return multi-valued fields, nested data, and fields processed for sorting or aggregations
"fields": ["publish_date", "category"]✅ Use when: you want runtime fields, scripted fields, or fields formatted for presentation.
docvalue_fields
- Specific to doc values — a columnar data structure optimized for sorting, aggregations, and scripting
- Commonly used for dates and numbers when you want them formatted
"docvalue_fields": [
  { "field": "publish_date", "format": "yyyy-MM-dd" }
]
✅ Use when: you want formatted field values, or data optimized for sorting/aggregations.
More: Elasticsearch docs on retrieving selected fields.
Note:
- Unlike what we thought,
_idis not stored in memory but on disk by default.
The right way to only return score + id from memory:
-
Enable
_idin docvalues (without this, the next step won’t work):es.cluster.put_settings(body={ "persistent": { "indices.id_field_data.enabled": True } }) print("✅ _id fielddata enabled.")This is deprecated, though. The recommended way is to artificially have an
idattribute (like we did) and register it as adocvalue. -
Minor changes to the query, but very significant:
profile = es_client.search(
    index="search_185_dev_v1",
    profile=True,
    size=1000,
    source=False,
    query={
        "match": {
            "block.text.text": "AI"
        }
    },
    docvalue_fields=['_id'],
    stored_fields="_none_",  # not None (default), not [], must be
                             # _none_ to disable this entirely (wth)
)
Check the current status of all nodes
thread_pool_stats = es_client.nodes.stats(metric="thread_pool")

for node_id, stats in thread_pool_stats["nodes"].items():
    thread_pools = stats["thread_pool"]
    search_pool = thread_pools.get("search", {})
    print(f"Node: {stats['name']}")
    print(f"  Active: {search_pool.get('active')}")
    print(f"  Queue: {search_pool.get('queue')}")
    print(f"  Rejected: {search_pool.get('rejected')}")
It’s not good if too many requests are getting rejected.
Check heap, CPU, disk
node_stats = es.nodes.stats(metric=["jvm", "fs", "os", "thread_pool"])

for node_id, node in node_stats["nodes"].items():
    name = node["name"]
    heap = node["jvm"]["mem"]
    cpu = node["os"]["cpu"]
    fs = node["fs"]["total"]

    print(f"\nNode: {name}")
    print(f"  Heap used: {heap['heap_used_percent']}%")
    print(f"  CPU load avg (1m): {cpu['load_average']['1m']}")
    print(f"  Disk free: {fs['free_in_bytes'] / fs['total_in_bytes']:.1%}")
Ideally on each node:
- Heap used < 60%
- CPU load minor
- Disk used < 80%
Take-home
If you remember nothing else from this post, remember these:
- Shard sizing first. Aim for 10–50 GB per shard and 50–100 shards per node. Too many tiny shards is the silent killer — file handles, merges, and JVM overhead pile up before you notice.
- Segments compound. They grow with every refresh. Force-merge when they get out of hand, but know it’s expensive — schedule it.
- Refresh is not free. During bulk indexing, set
refresh_interval: -1, load, then refresh once. This single change often cuts indexing time dramatically. - Profile before you optimize.
profile=Trueis your friend. The bottleneck is rarely where you assume — in our case, fetch dominated even when we thought we were memory-only. _idlives on disk by default. If you need score-plus-id-only queries to be fast, you needdocvalue_fields=['_id']andstored_fields="_none_". Either alone is not enough.- Watch the boring metrics. Rejected thread-pool requests, heap > 60%, disk > 80% — these are your early-warning signs. By the time queries slow down, you’re already late.
Performance work in Elasticsearch is mostly about not creating problems for yourself: right-sized shards, controlled refresh, and profiled queries. Get those three right and most of the rest takes care of itself.